Benchmark
HistGramBench: can AI redraw the diagrams in old mathematics books?
November 1, 2026 · Minh Quang Tran, Carter He, Cameron Bloch, Zitai Huang, Thien Truong Vo, Trong Nguyen Tran and Isaac Chen
Abstract
Thousands of old mathematics books have been digitized by libraries, but the diagrams in those books are still just images. As a result, there’s no way to search them for, say, every drawing where a line touches a circle. One fix is to have an AI redraw each diagram as a short bit of drawing code. To test this idea, we built HistGramBench on 2,507 diagrams from 95 books and journal articles published between 1551 and 1933, spanning eight languages. Across six affordable AI models tested, they recovered between 20% and 60% of the facts we checked. Crucially, most of what they missed came from answers that produced no drawing at all.
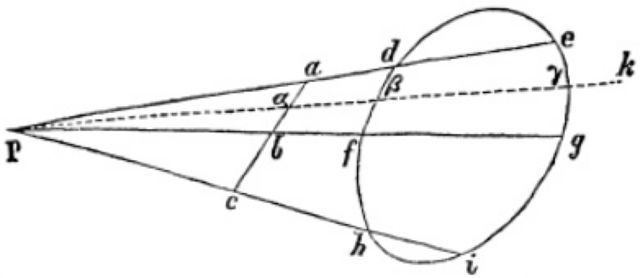
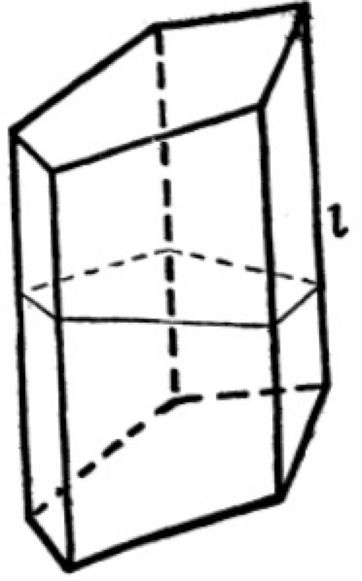
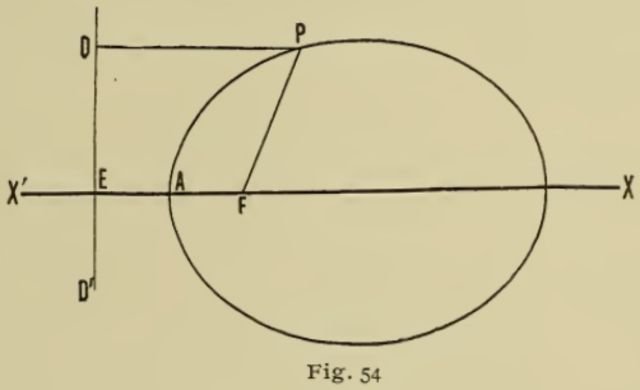
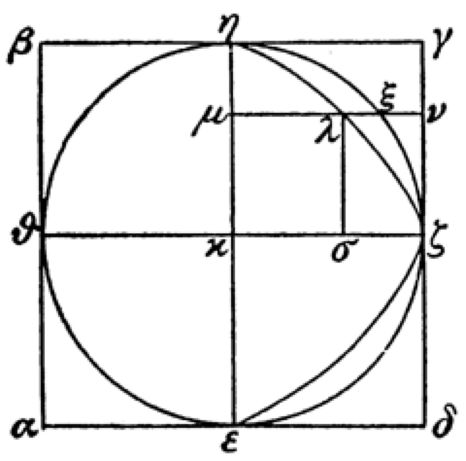
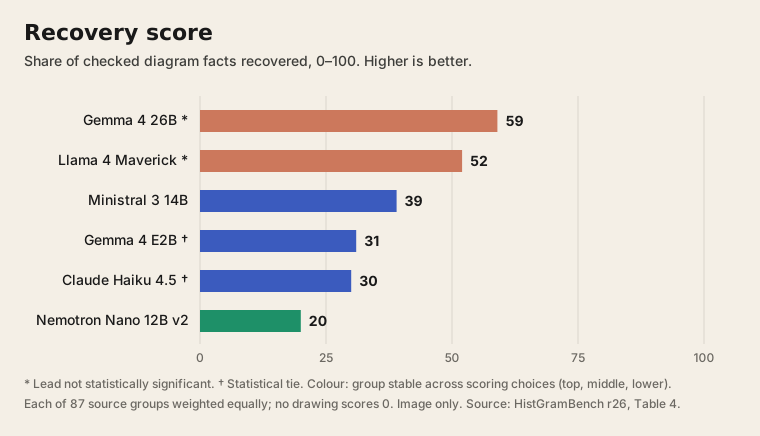
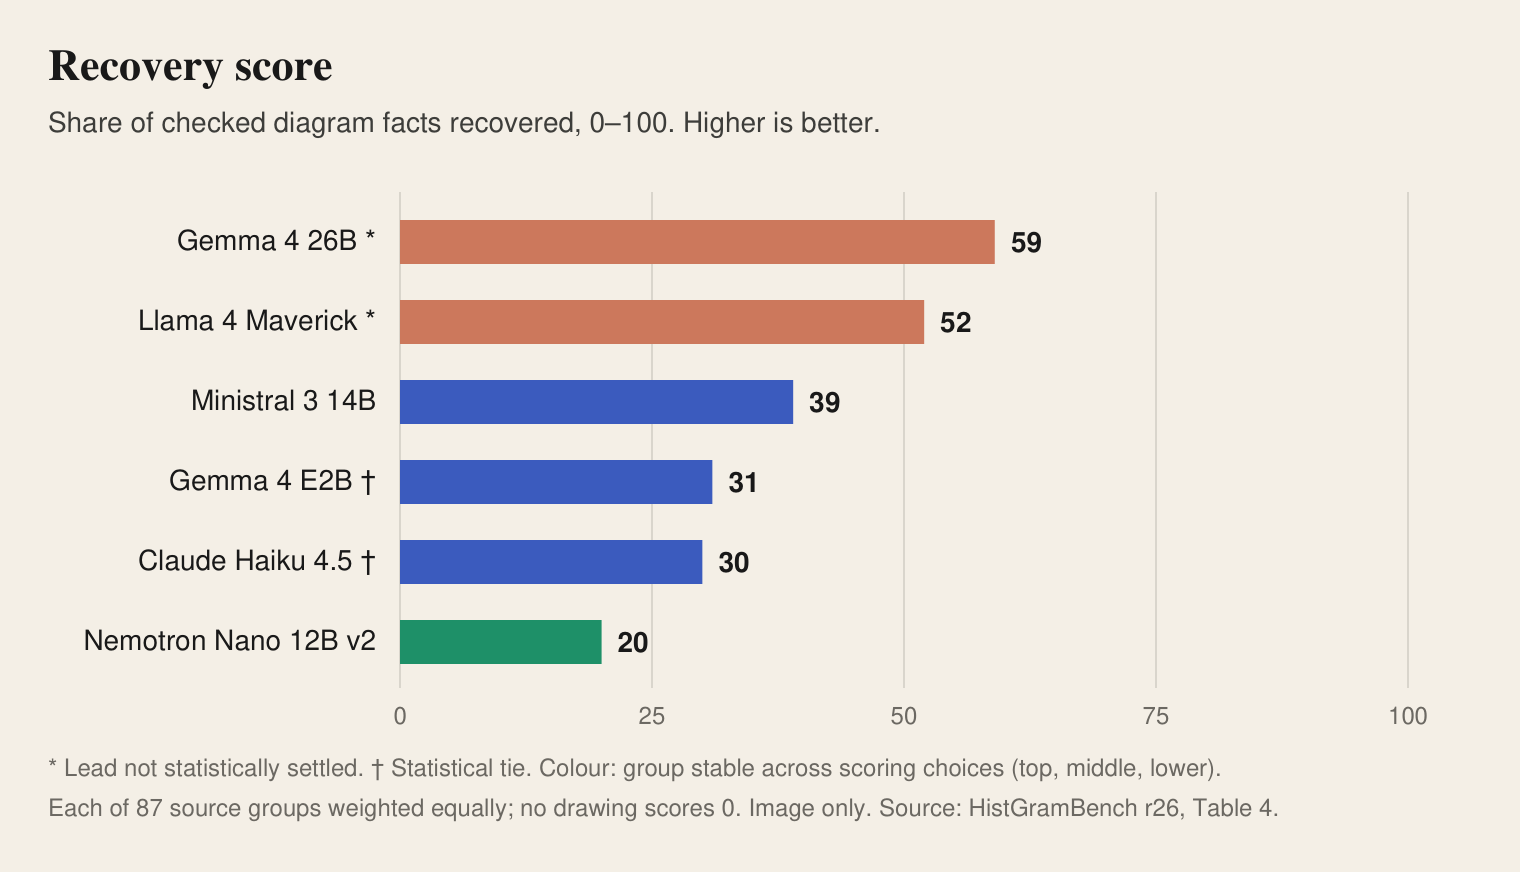
Results at a glance
To evaluate performance, each model saw every diagram once and wrote a drawing program for it. We then scored each drawing by the share of the diagram’s checked facts it got right, averaging the results so that all 87 groups of similar sources carry the same weight. Meanwhile, any missing drawing received a 0.
Recovery score
For a diagram with 100 checked facts, how many the redrawing gets right. The higher the better.
How the test works
With an old printed plate, you don’t have an original source file to compare the redrawing against pixel by pixel. Instead, we record the facts a reader gets from the figure, then check each one in the model’s own drawing—wherever it put things and at whatever size. Specifically, these cover facts about objects (points, lines, circles), relations (such as a point on a circle), and labels (which printed letter goes with which point).
The model sees a scanned diagram
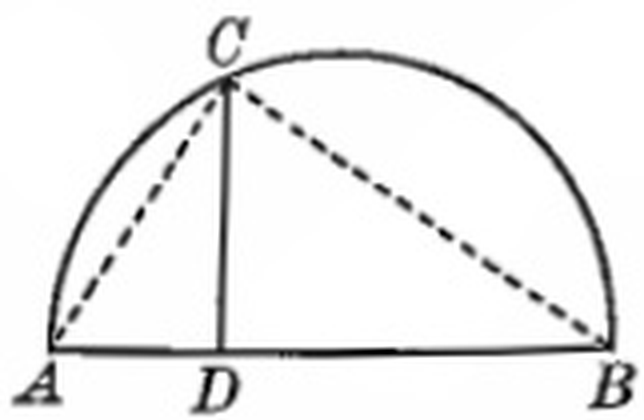
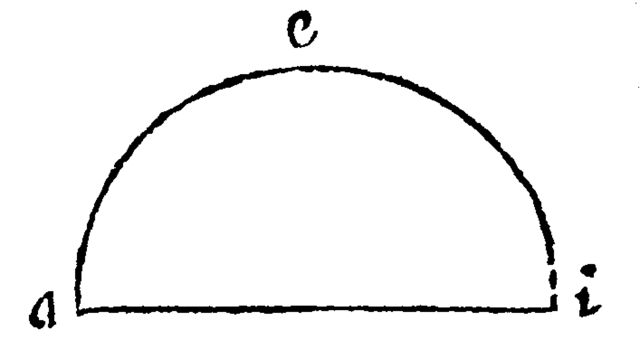
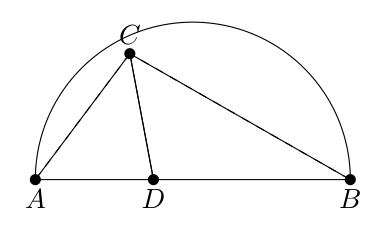
For example, here is a figure from The Teaching of Geometry (1911). To start, the model sees only this raw image.
It writes a short drawing program
\begin{tikzpicture}
  \draw (0,0) arc (180:0:2cm);
  \coordinate (A) at (-2,0);
  \coordinate (B) at (2,0);
  \coordinate (C) at (0,{sqrt(4)});
  \coordinate (D) at (0,0);
  \draw (A) -- (C) -- (B) -- (A);
  \draw (C) -- (D);
  \node at (A) [below left] {$A$};
  \node at (B) [below right] {$B$};
  \node at (C) [above] {$C$};
  \node at (D) [below] {$D$};
\end{tikzpicture}
In response, here is the actual answer from Llama 4 Maverick, written in TikZ, a common language for drawing diagrams as code. Because all points and lines have names, you can easily inspect and search for them.
We check the facts on its drawing
- D lies on the line AB Found
- CD meets AB at a right angle Found
- Letter C sits on point C Found
- C lies on the semicircle Missed
- The semicircle ends at A Missed
That yields the score: 34 out of 40 checked facts are correct here. To build the checklist fairly, two AIs from different companies had to agree on a fact before it was checked. And if a drawing can’t clearly settle a fact on its own, other AIs step in to decide it.
One diagram, six redrawings
Here is that same 1911 figure as each model drew it. In this evaluation, location, line style, and size don’t matter; instead, all that counts is whether the geometric facts check out.
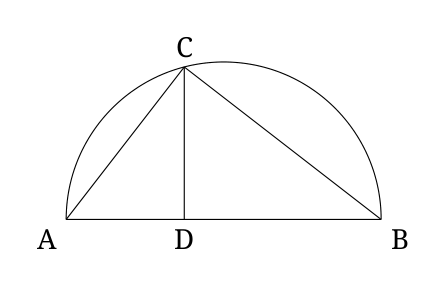
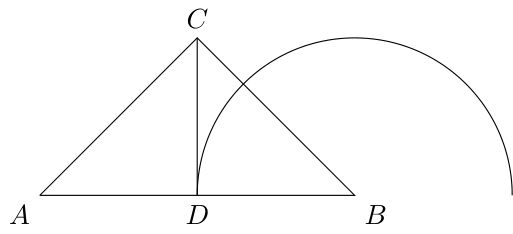
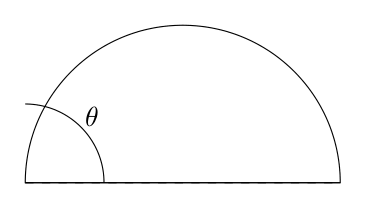
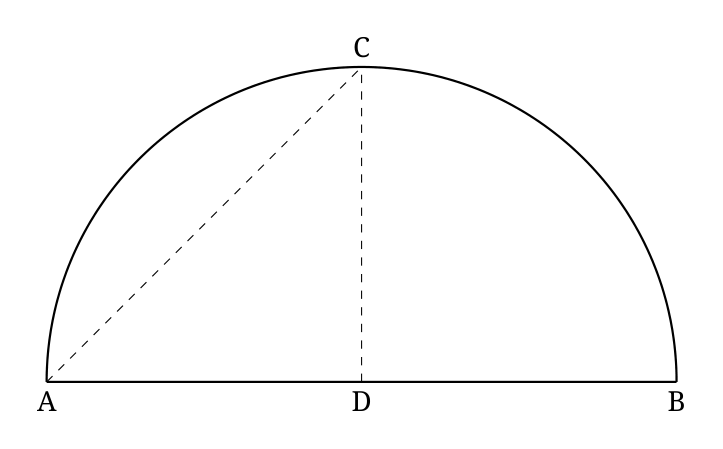
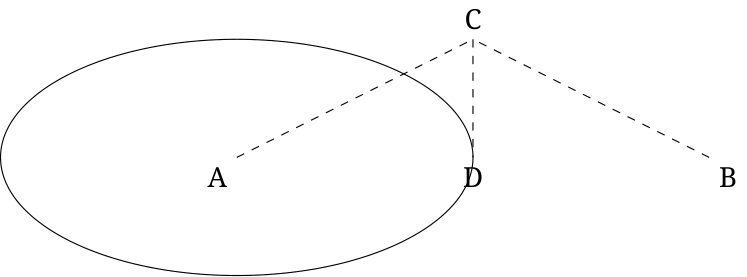
Inspect one redrawing
Pick a check to see it on both drawings.
Printed in 1911
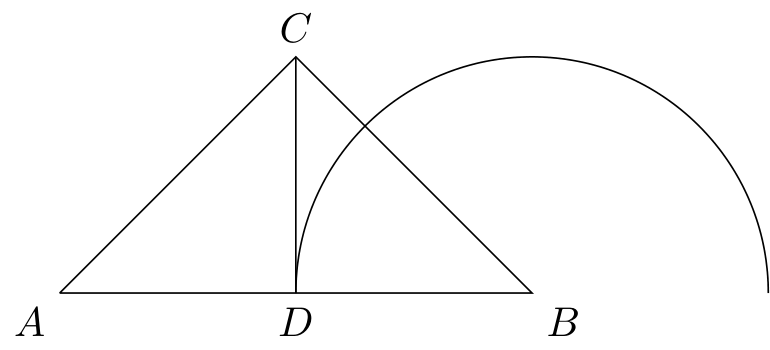
AI redrawing (Llama 4 Maverick)
| Check | Result |
|---|---|
| The letters A, B, C and D each sit on their point 4 checks | Found |
| D lies on the line AB | Found |
| CD meets AB at a right angle | Found |
| C lies on the semicircle | Missed |
| The semicircle ends at A | Missed |
| The semicircle ends at B | Missed |
34 of 40 checks found: this diagram scores 85.
Most lost points are drawings that never appear
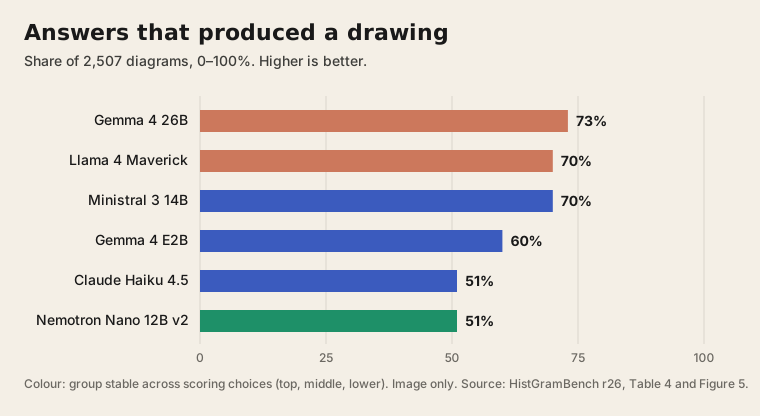
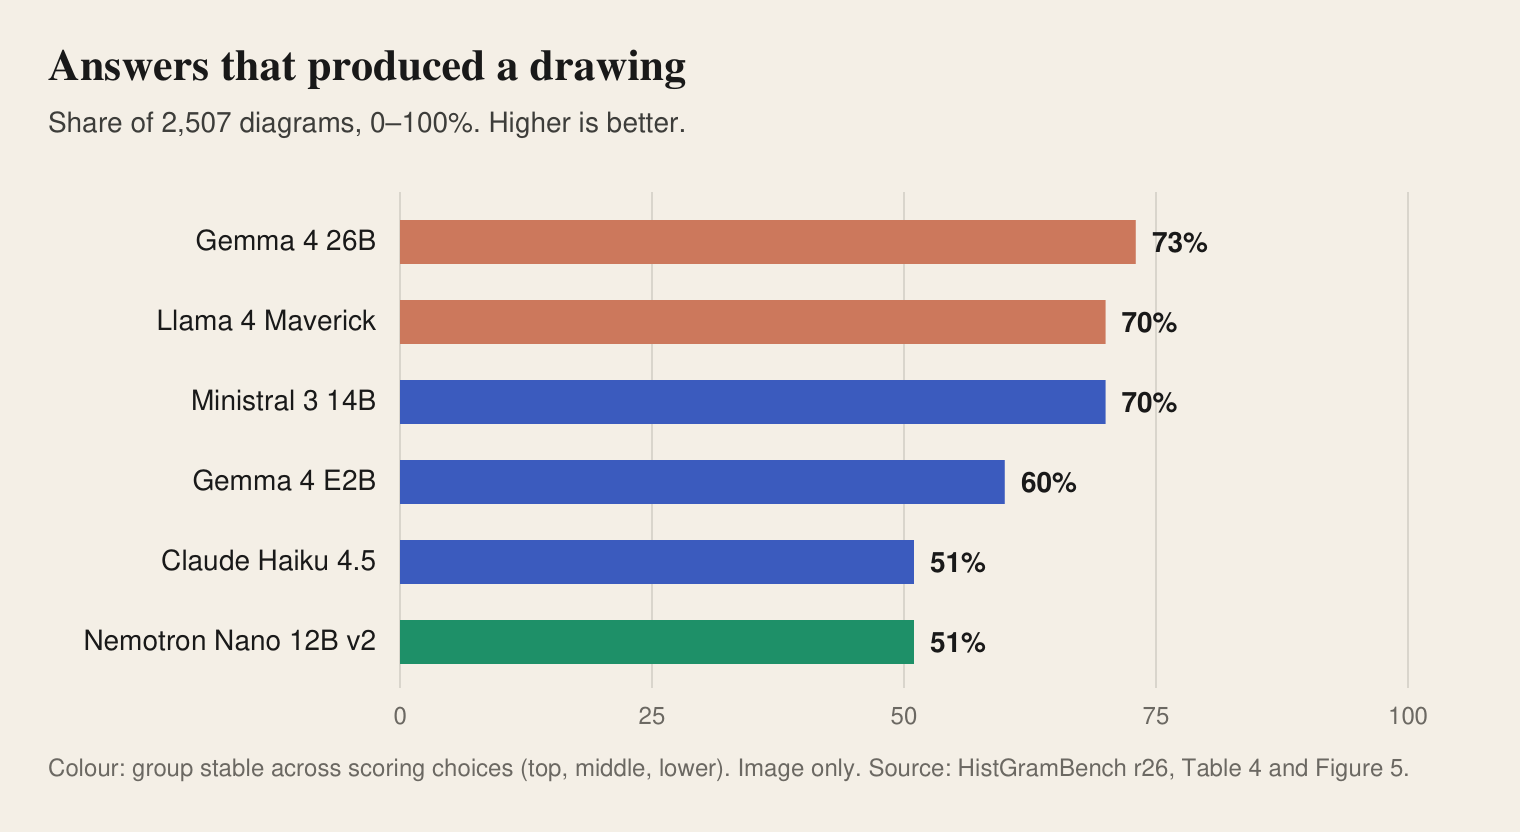
If the code doesn’t draw anything, it doesn’t matter how well the model read the diagram: it still gets a 0. In practice, this happened on 27% to 49% of answers. While some responses were cut off and others used code we don’t allow, mostly the code just didn’t run. As the breakdown below shows, each model breaks in its own way.
How often the code produces a drawing
Percent of the 2,507 diagrams where the answer turned into an image. Image only. More is better.
Score when the drawing appears
Same score, counting only answers that drew something. Claude Haiku 4.5 goes from fifth to second place.
In fact, missing drawings account for 58% to 85% of the points each model lost. By comparison, when there was a drawing, models got back roughly 55 to 81 out of 100. Take Claude Haiku 4.5 as an example: it finished in fifth place overall, but on the diagrams that both it and Llama 4 Maverick actually drew, it recovered slightly more.
Precise geometry is the hardest part
Naturally, not all facts are equally easy. Models do best with letters and points, but they struggle most with the stuff a ruler and compass guarantee: exactly parallel lines, exactly right angles, or a line that just touches a circle.
Facts recovered, by kind
Each bar spans the worst to the best of the 6 models, out of 100. Image only.
Does the page text help?
To see if context helped, we re-ran all the models with up to 1,200 characters of the surrounding page text (caption first). Even so, across all 6 models the mean score shifted by only about 1.5 points—well within the 14-point band we agreed on in advance as “no real difference.”
Change in score with page text added
Points gained or lost, by model. The shaded area is the pre-registered “no real difference” range.
Leaderboard
Here are all 6 models, with every headline number. You can sort on any column heading, or select a model to highlight it in all the charts.
| Model | Group | Recovery score image only |
Score image + text |
Produces a drawing |
Score when it draws |
Main failure |
|---|---|---|---|---|---|---|
| Gemma 4 26BGoogle | Top | 59 | 51 | 73% | 81 | Compile errors |
| Llama 4 MaverickMeta | Top | 52 | 51 | 70% | 72 | Disallowed commands (292) |
| Ministral 3 14BMistral | Middle | 39 | 50 | 70% | 66 | Compile errors |
| Gemma 4 E2BGoogle | Middle | 31 | 32 | 60% | 58 | Compile errors |
| Claude Haiku 4.5Anthropic | Middle | 30 | 30 | 51% | 73 | Missing document setup (1,009) |
| Nemotron Nano 12B v2NVIDIA | Lower | 20 | 27 | 51% | 55 | Cut off mid-answer (651) |
- Recovery score
- Share of a diagram’s checked facts the redrawing gets right, averaged so each group of related sources weighs the same. Out of 100.
- Group
- The three groups stayed apart in all ten scoring versions we tried.
- Produces a drawing
- Share of answers where the code ran and made a picture.
- Score when it draws
- The score, counting only answers that made a picture.
How much to trust the ranking
To test how solid the results are, we rescored everything 10 different ways: with different judge models, tighter and looser rules, and different source weights. Across these tests, the 6 models always came out in the same order, except Gemma 4 E2B and Claude Haiku 4.5, which are tied anyway. In every case, the 3 groups held.
Gemma 4 26B is 6.5 points ahead of Llama 4 Maverick, but that lead isn’t clear-cut under some stricter checks. In practice, then, you can call it a tie.
Limits
- Answer keys were not verified by humans. Instead, facts had to be agreed on by 2 AI models, and the judging itself was done by other AI models. While earlier tests on synthetic diagrams showed the agreed facts were almost always true, they remain incomplete.
- Only six low-cost models. We specifically chose models a library could afford to run over whole collections; as a result, we didn’t try the best frontier models.
- One answer for each diagram. We had each model answer each diagram just once, so we didn’t measure how much the answers vary between runs. Consequently, that adds noise to every comparison here, including the page-text test.
- We simplified for clarity. Scores here are rounded, and confidence intervals are omitted. For exact values, intervals, and all the variants, see the full paper.
Read more
- The full paper (link coming at publication)
- Code and scoring harness on GitHub ↗
- Dataset on Hugging Face ↗ (access on request until publication)
Selected references
- Manders, K. (2008). The Euclidean diagram (1995). In P. Mancosu (Ed.), The philosophy of mathematical practice. Oxford University Press.
- Netz, R. (1999). The shaping of deduction in Greek mathematics. Cambridge University Press.
- Belouadi, J., Ponzetto, S. P., & Eger, S. (2024). DeTikZify: Synthesizing graphics programs for scientific figures and sketches with TikZ. Advances in Neural Information Processing Systems 37.
- Periasami, A. V., Wang, J., & Dhingra, B. (2026). Vision2Code: A multi-domain benchmark for evaluating image-to-code generation. arXiv preprint.